
Crashes and unexpected restarts are a source of immense frustration for many computer users. Not only can they lead to the loss of unsaved work, but also deteriorate your machine’s health over time. While there are numerous potential causes – ranging from hardware issues to outdated drivers or simply blocked processes by firewalls – figuring out which one is actually causing these malfunctions can be incredibly difficult; especially as it often involves loads of trial-and-error testing!
Windows 10 offers an incredible tool to help you troubleshoot computer crashes – Windows Minidump Files. When used properly, this system can make all the difference in speeding up your PC diagnostics and protection against data loss. Ready to understand more about these mysterious .dmp files? Let’s dive into their purpose and learn how we can use them for our benefit!
What is a Windows Minidump (.dmp) file?
When Windows crashes, it preserves the details of this unfortunate event in a minidump file. This small collection of data is encoded with the time and date that such an unpleasant incident occurred for easy reference. All the essential information about what went wrong can be found inside these files stored away neatly in %systemroot%\Minidump – including exact processes being executed when disaster struck!
- The error message and its parameters.
- RAM & CPU resource consumption.
- The appropriate kernel-mode call stack.
- What programs and applications were running at the time
- The state that the processor was in when it stopped – Processor context (PRCB).
- Process information and kernel context (EPROCESS) concerning both the process and thread experiencing the problem.
Despite its small size, the 2MB crash file only offers limited insight into errors that occurred during a crash; it does not include any supplementary data.
What are Minidump Files Useful For?
Windows minidump files are powerful diagnostics tools for uncovering the mysterious cause of a system crash. By inspecting these dmp files, you can unveil what precisely broke down at the time and even discover why it occurred in the first place – giving invaluable insight into keeping your computer running reliably!
Windows minidump files can be a lifesaver when it comes to quickly troubleshooting Blue Screen of Death (BSoD) issues. Unlike full size crash dump files, these are easily manageable and provide the necessary information for diagnosing problems with efficiency. So if you ever find yourself stuck on that dreaded BSoD, our guide will help get your computer back up and running in no time!
Do I Need a Special Program to View DMP Files or Open Them?
To access the hidden secrets of a Windows minidump file, you need special software – one such example being WinDbg, Microsoft’s versatile and user-friendly Debugger Tool. Just head over to their website for an instant download!
If your computer has been experiencing blue screens of death, BlueScreenView can be a great resource for deciphering the cause. Download and extract this nifty program to get up-to-date information on any Windows minidump files – giving you an efficient way to figure out why these pesky crashes keep occurring!
WhoCrashed enables users to diagnose their system’s problems in an easy and thorough manner. With a user-friendly interface, WhoCrashed provides more than just a summary of what is causing the issue – it offers detailed minidump analysis as well along with possible solutions for the problem at hand.

Don’t let pesky viruses compromise your computer’s security! Be sure to scan any third-party programs you download with a virus checker before use, so that nothing can sneak onto your device unnoticed.
How to Read and Analyze Minidump Files to Troubleshoot System Crashes
Unlock the mysteries of your minidump files with WinDbg – included as part of Windows Driver Kit. With just a few simple steps, you’ll be able to explore and interpret its content!
- Start by hitting the Windows key on your keyboard, and type “WinDbg” into the search box. If you do not already have the debugging tool installed, you will be redirected to install it.
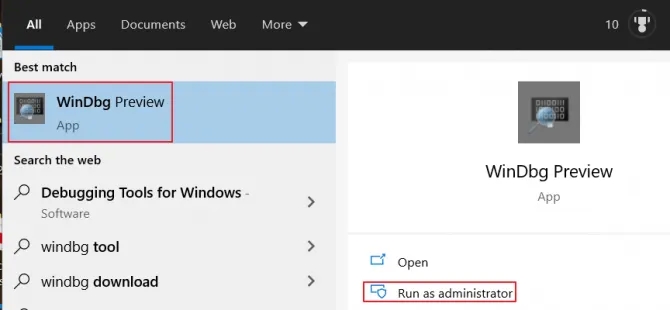
- Open the Windows Debugger Program by right-clicking it and selecting “Run as Administrator”.
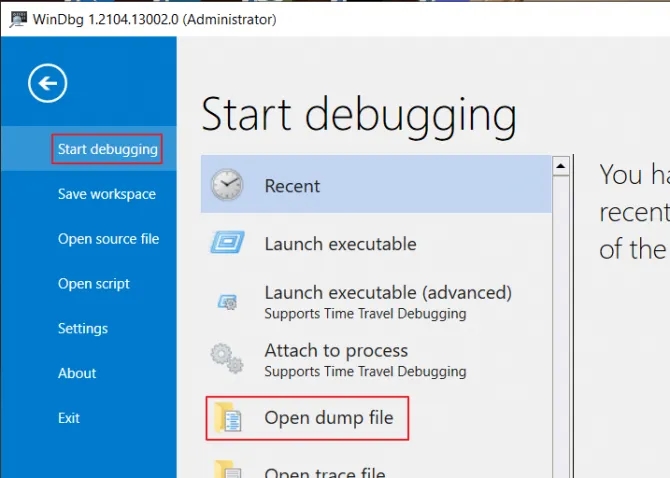
- In the menu bar, select “File,” then “Start Debugging” on the left.
- On the right, select “Open Dump File.”
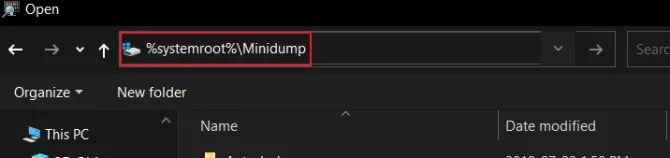
- Look for the folder containing the desired dump file. As mentioned earlier, the default location for this is “%systemroot%\Minidump.” Double-click on the most recent minidump file. Opening the dmp file may take a few minutes.
- Near the bottom of the debugger window, type “!analyze -v” into the input box and press Enter. This will also take a few minutes to complete.
Get to the bottom of your tech issue by searching for two crucial headings – “MODULE_NAME” and “IMAGE_NAME.” Identifying what program or driver is causing the problem will help you gain insight on how best solve it right away!
Using a Third-Party App to Analyze and View Minidump (.dmp) Files – BlueScreenView
Tired of struggling to open minidump files? Relax – BlueScreenView is here! Installing this third-party application will enable you to effortlessly access and analyze these tricky data sets.
- Download BlueScreenView from this website link. You will need to choose between the 32-bit and 64-bit option.
- Choose to save the file.
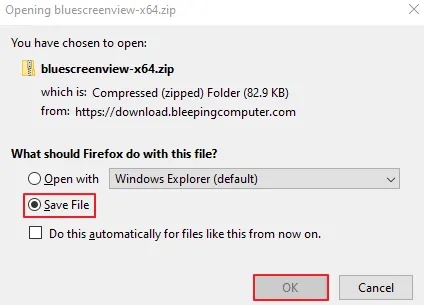
- Save BlueScreenView File to Download the Tool
- Head to your downloads folder and right-click the file.
- Extract all of the files to an unzipped folder.
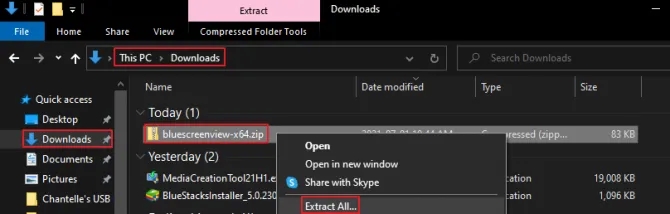
- Extract All Files from BlueScreenView Zipped Folder.
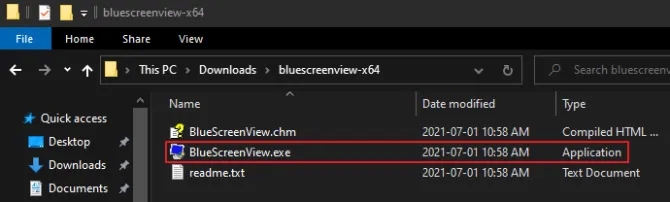
- In the unzipped folder, run the BlueScreenView application file.
- Run BlueScreenView Application
- BlueScreenView will now automatically scan your minidump file.
- Crash details will be displayed in a list within the top window pane of BlueScreenView.
- In the lower window pane, you will see associated drivers with the crash.
- Double-click on the driver of the latest crash to see the properties of the errors in a neat table format.
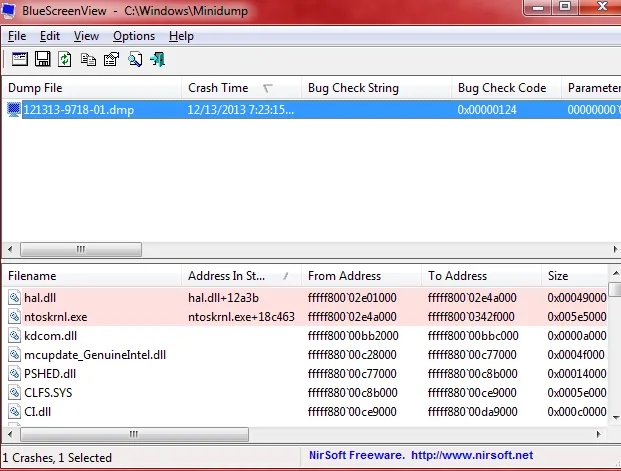
Get an in-depth look into your computer’s recent activity with this comprehensive table, providing you the DMP file name, crash time, bug check result and code for further investigation – plus find out which driver caused it all! With a glance at version information included right there on the page.
To arm technicians for quick resolution of technical issues, send an HTML report containing the necessary details. Crash files can be effortlessly saved to simplify debugging efforts when problems recur regularly – just right-click and select ‘Save Selected Items’.
Wrapping up
Windows minidump (.dmp) files can be the difference between a quick system fix or headache-inducing hours of troubleshooting. With just one file, you’ll have access to crucial information that reveals what’s causing your computer crashes and offers potential solutions for recovery right away. Though mini dumps might not hold as much data as full Crash Dumps, they’re still an invaluable asset in any tech toolbox!